

Inside the operating system,
real screens.
These screens are from the workspace of a home goods retailer. The company and its data are made up, the screens are real. A person uploaded five files, and a Claude client built everything else through DEHA Lab's builder bridge.
It sets itself up.
You describe the work, your own Claude writes the setup, and the operating system checks every line before it goes live. This is the session that built the workspace below, call by call, with the time of each.
The job
Set up our sales data from these five files. Load it, map it, prepare the quarterly report and run it every Monday, and build a dashboard and a sales analyst.
13:41:30config.get · docs.search · registry.steps
It reads first: what the workspace holds, how a file connector is written, which fields the loading step takes.
13:42:38config.validate · config.deploy
It writes a connector for each of the five files. The check passes and it goes live.
13:42:53config.validate
It writes the loading workflow with a misspelt field, on purpose, to show the gate. It is refused, and the refusal names the field and why.
CS-2003 steps[0].config.conector_ref Extra inputs are not permitted CS-2004 steps[0].config.connector_ref references connector '', but no such connector is defined in connectors.13:43:02config.validate · run.pipeline
It fixes the field, passes the check and runs it: five tables, 6,443 rows, in two seconds.
13:43:45idrak.automap · config.deploy
It asks İDRAK to propose a map: five objects and their keys. It adds the Turkish names, three links and a few synonyms, and puts it live.
13:46:23config.validate · run.pipeline
It writes the quarterly report, three SQL queries and a PDF, and runs it: a 64 KB report ready in 2.3 seconds.
13:47:29registry.widgets · config.deploy
It builds the dashboard: four figures, three charts and a table.
13:47:54config.deploy
It schedules the report for every Monday at 08:00.
13:48:14config.deploy
It builds the sales analyst: it clears personal data first, and the only workflow it may call is the report.
Done at 13:48:21. Forty calls in seven minutes: nine checks, seven saves, seven deploys. Nobody filled in a form.
What it built,
screen by screen.
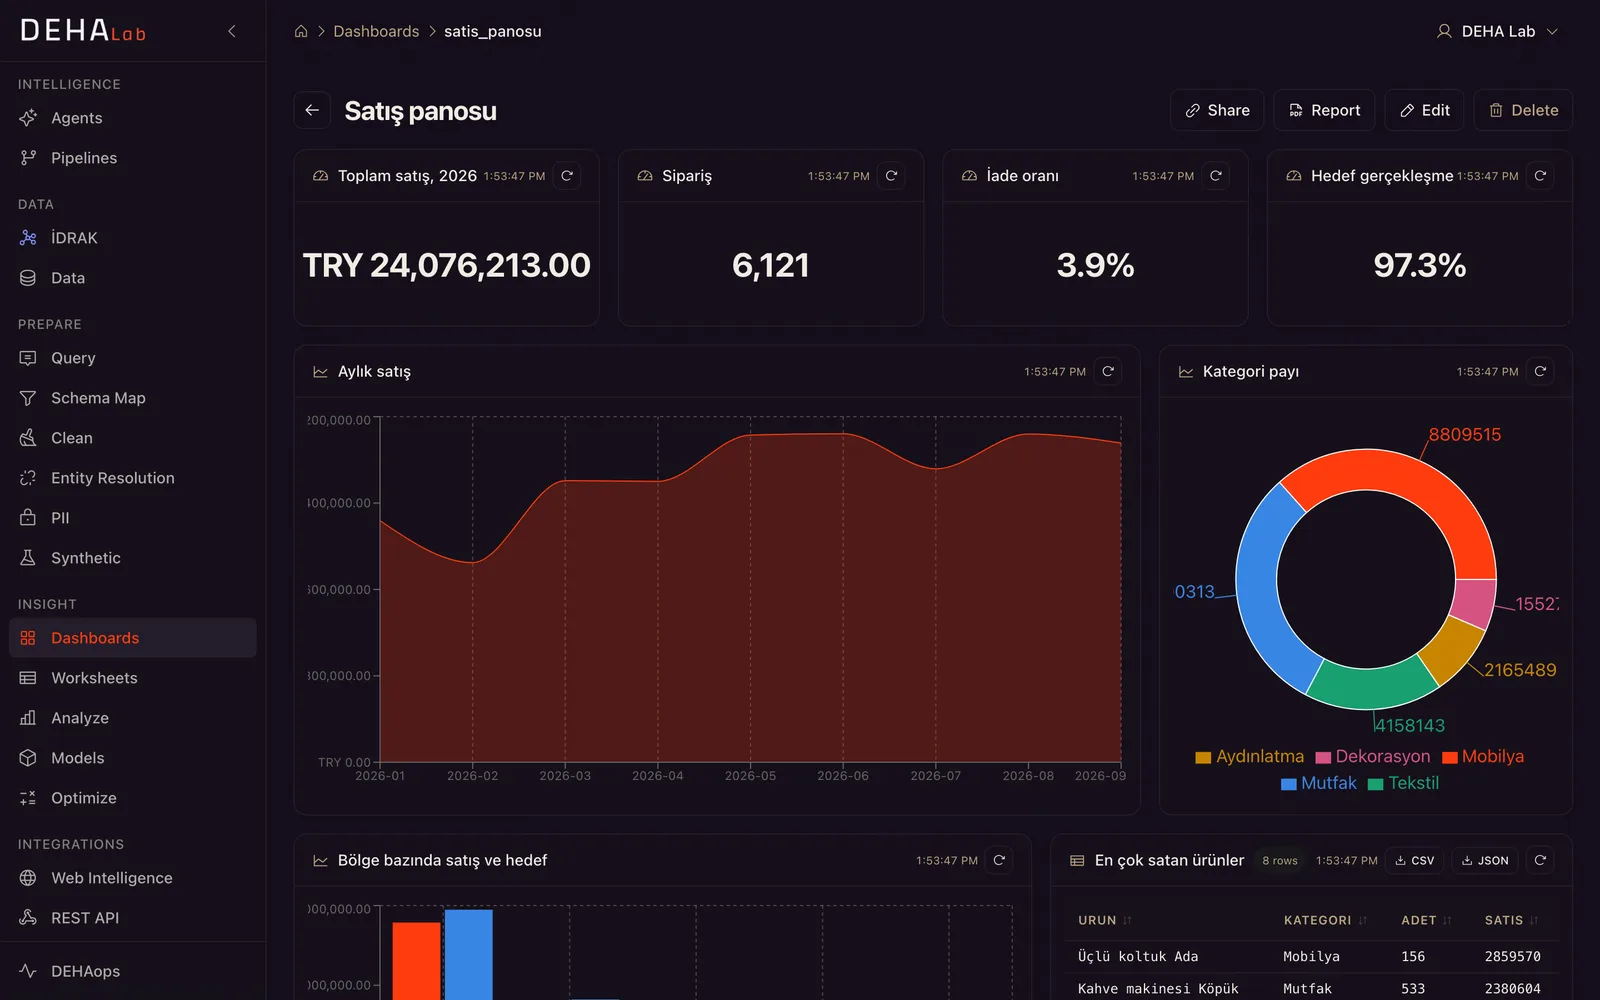
The sales dashboard
Four figures, monthly sales, each category's share and each region against its target. Every box is read from the data when the page opens.
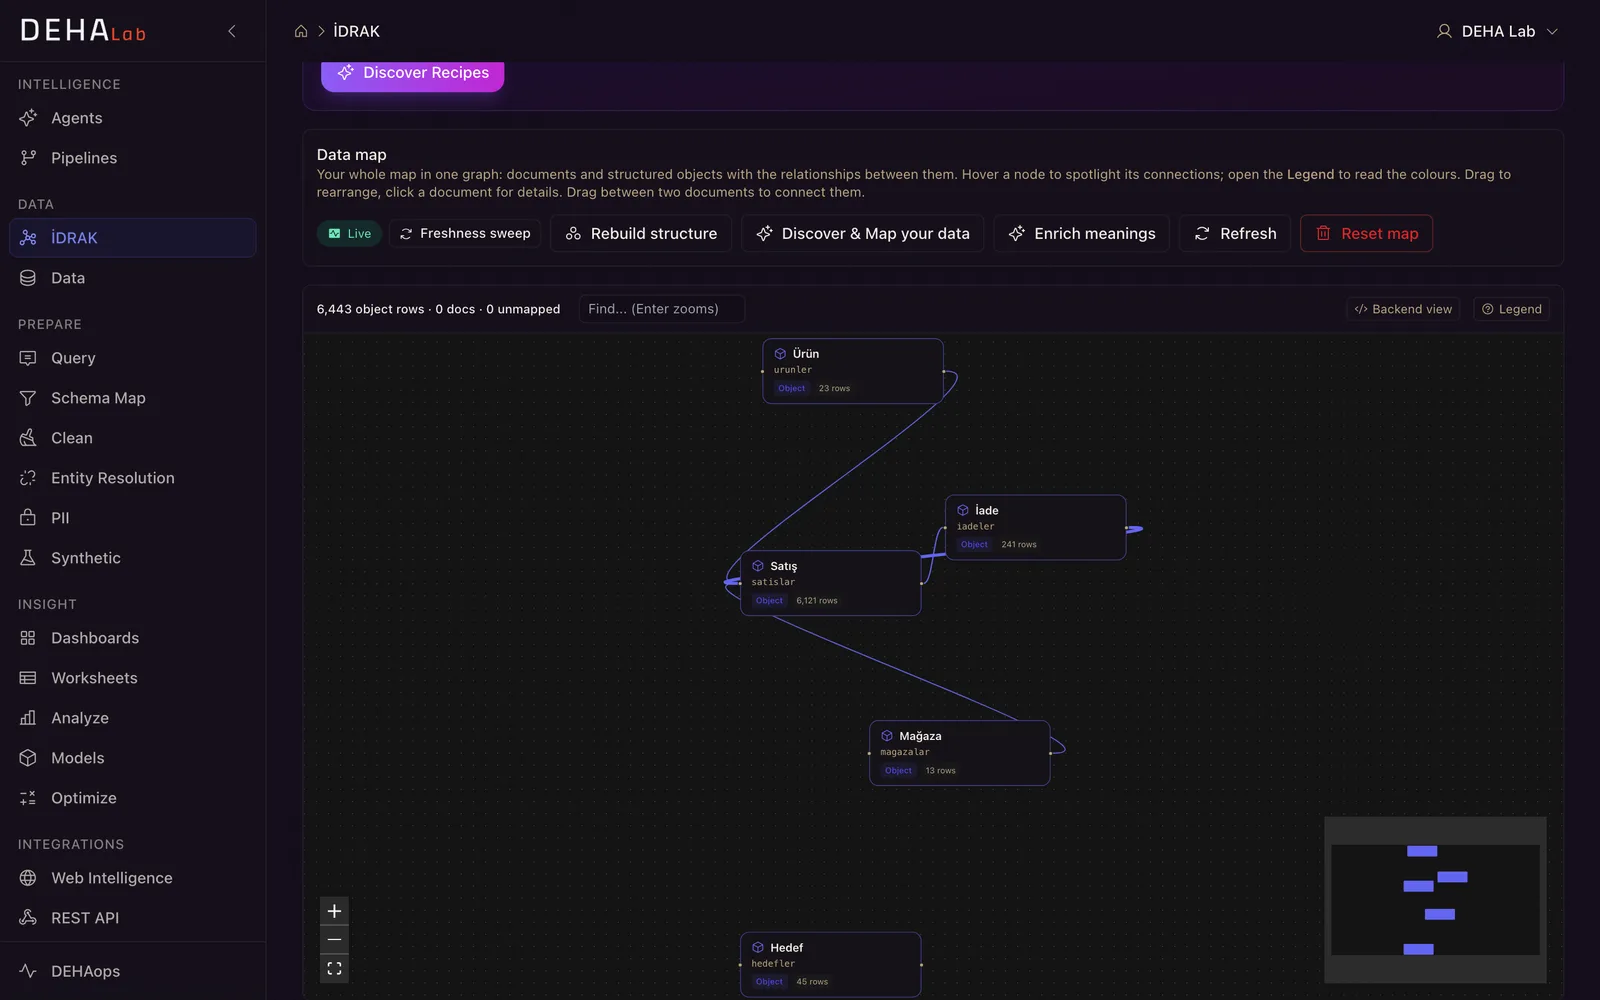
İDRAK's meaning map
Five objects, the links between them and 6,443 records. The AI answers from this map, not from a guess.
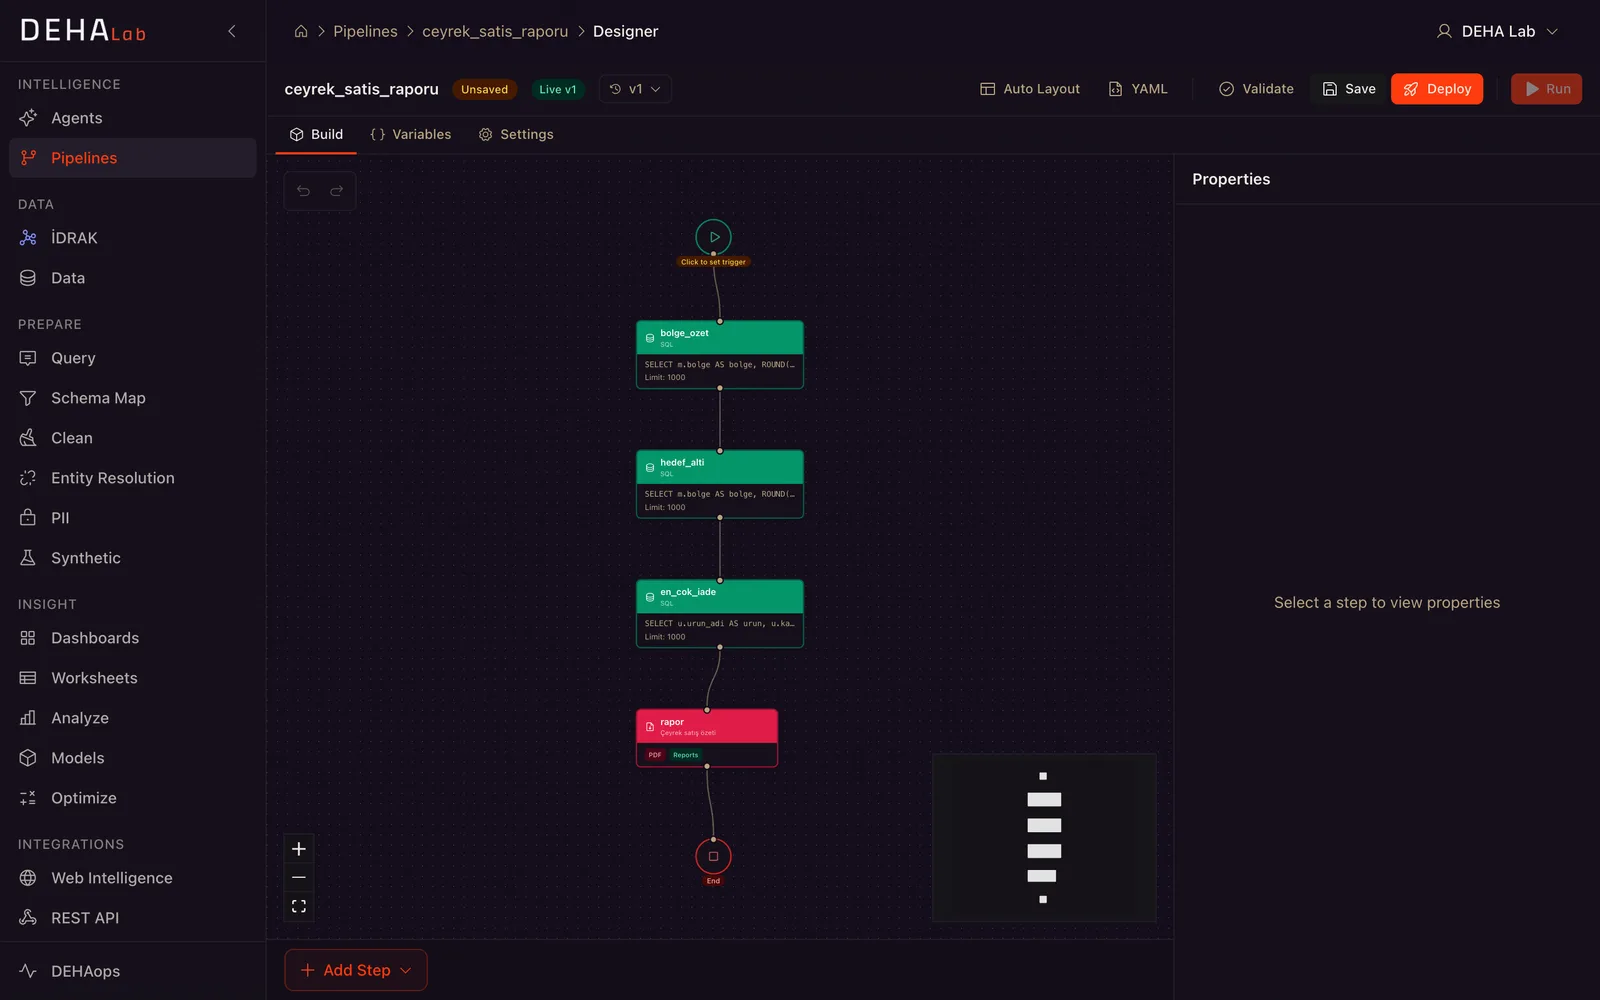
The workflow designer
The quarterly report: three SQL queries and a PDF. Each step is a box, and each box is a definition your team can read and change.
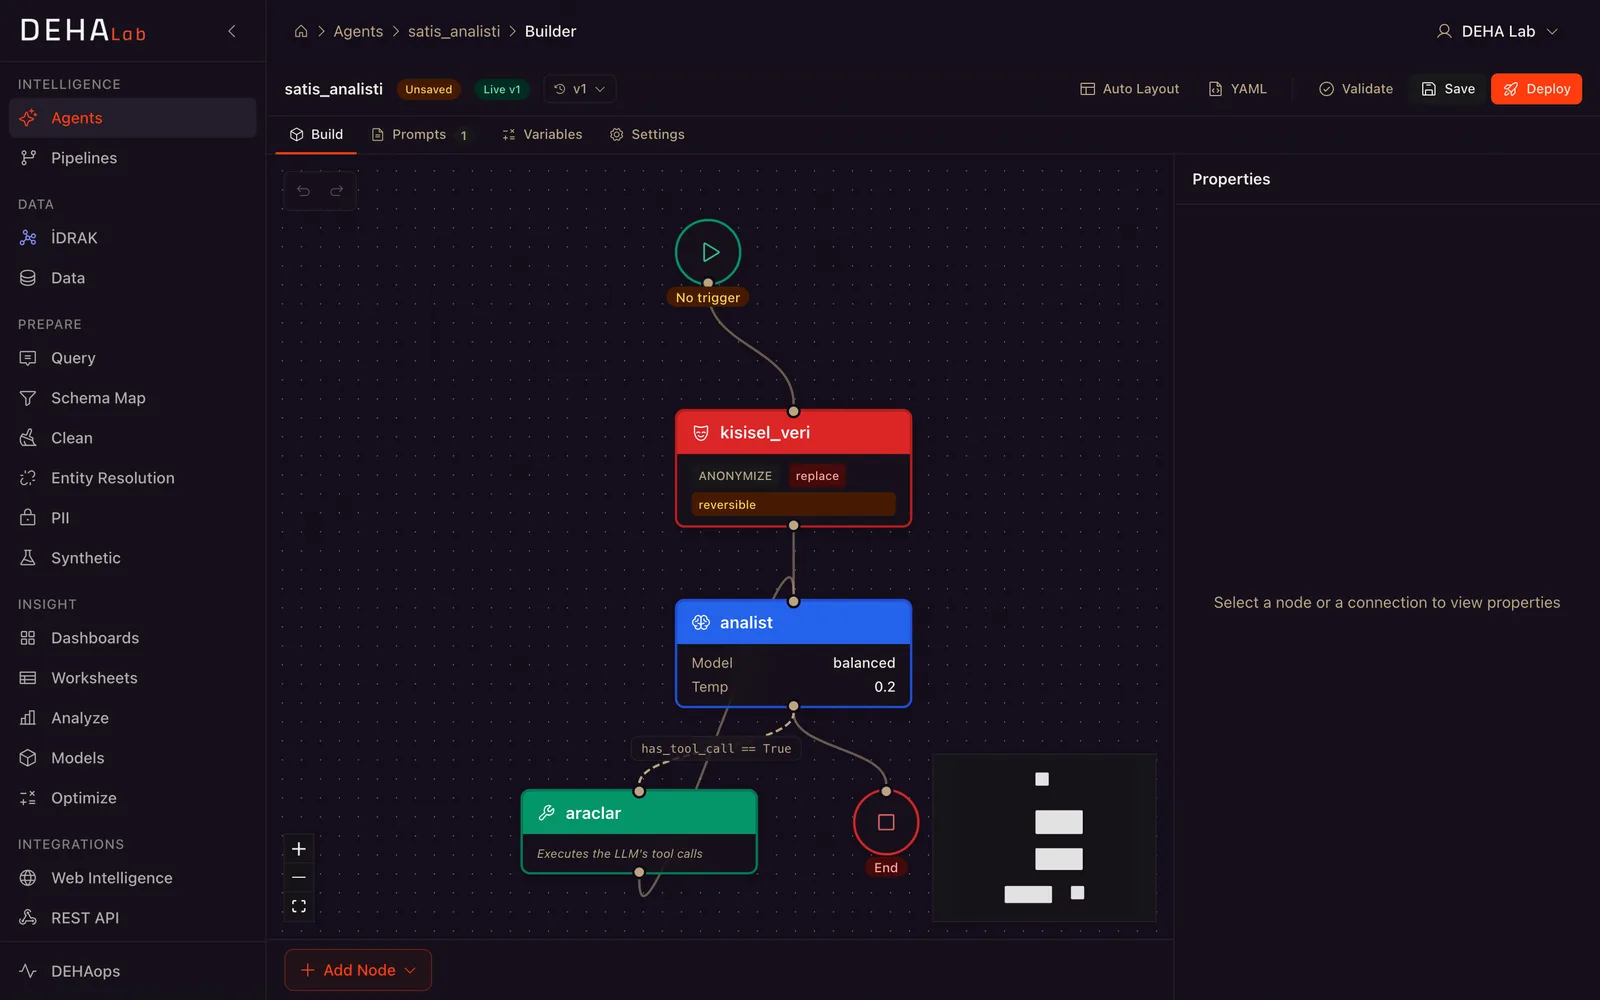
The agent builder
The sales analyst: personal data is cleared before the model sees it, and the only workflow it can call is the one it was given.
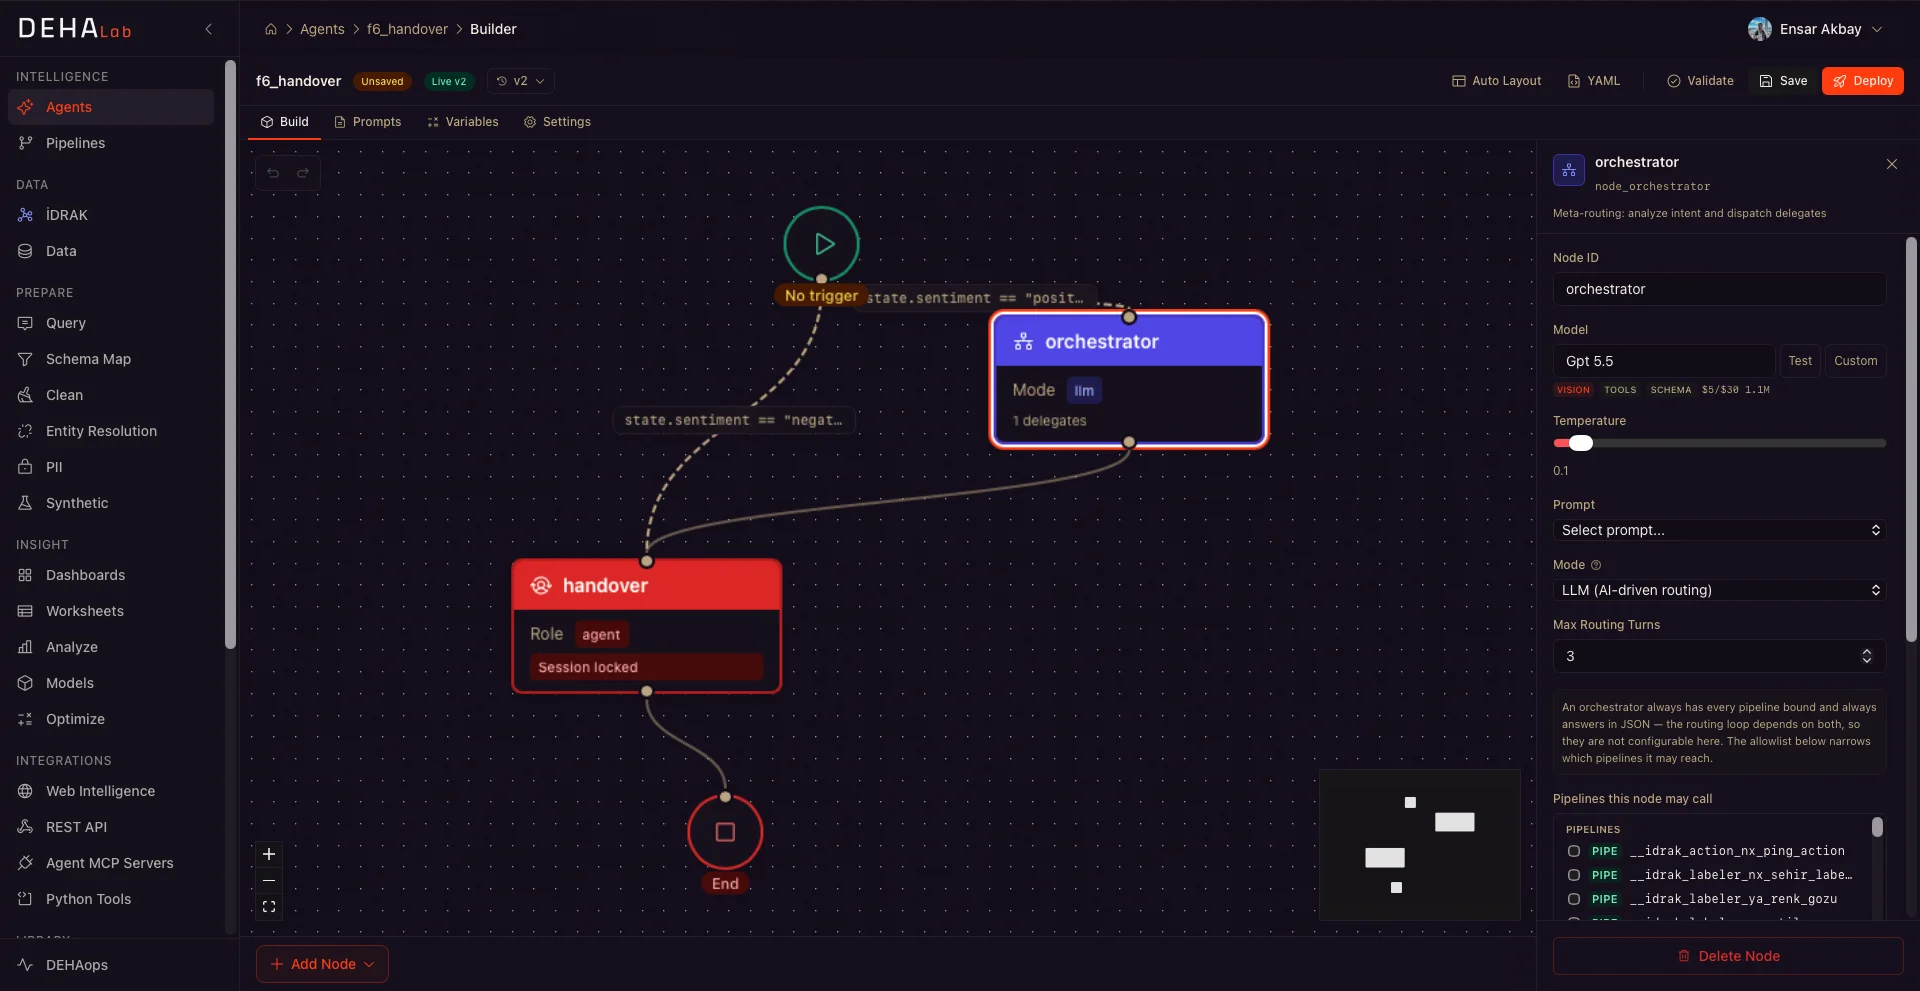
An agent that hands over
An orchestrator reads the mood of a message. When it is negative, the conversation goes to a person.
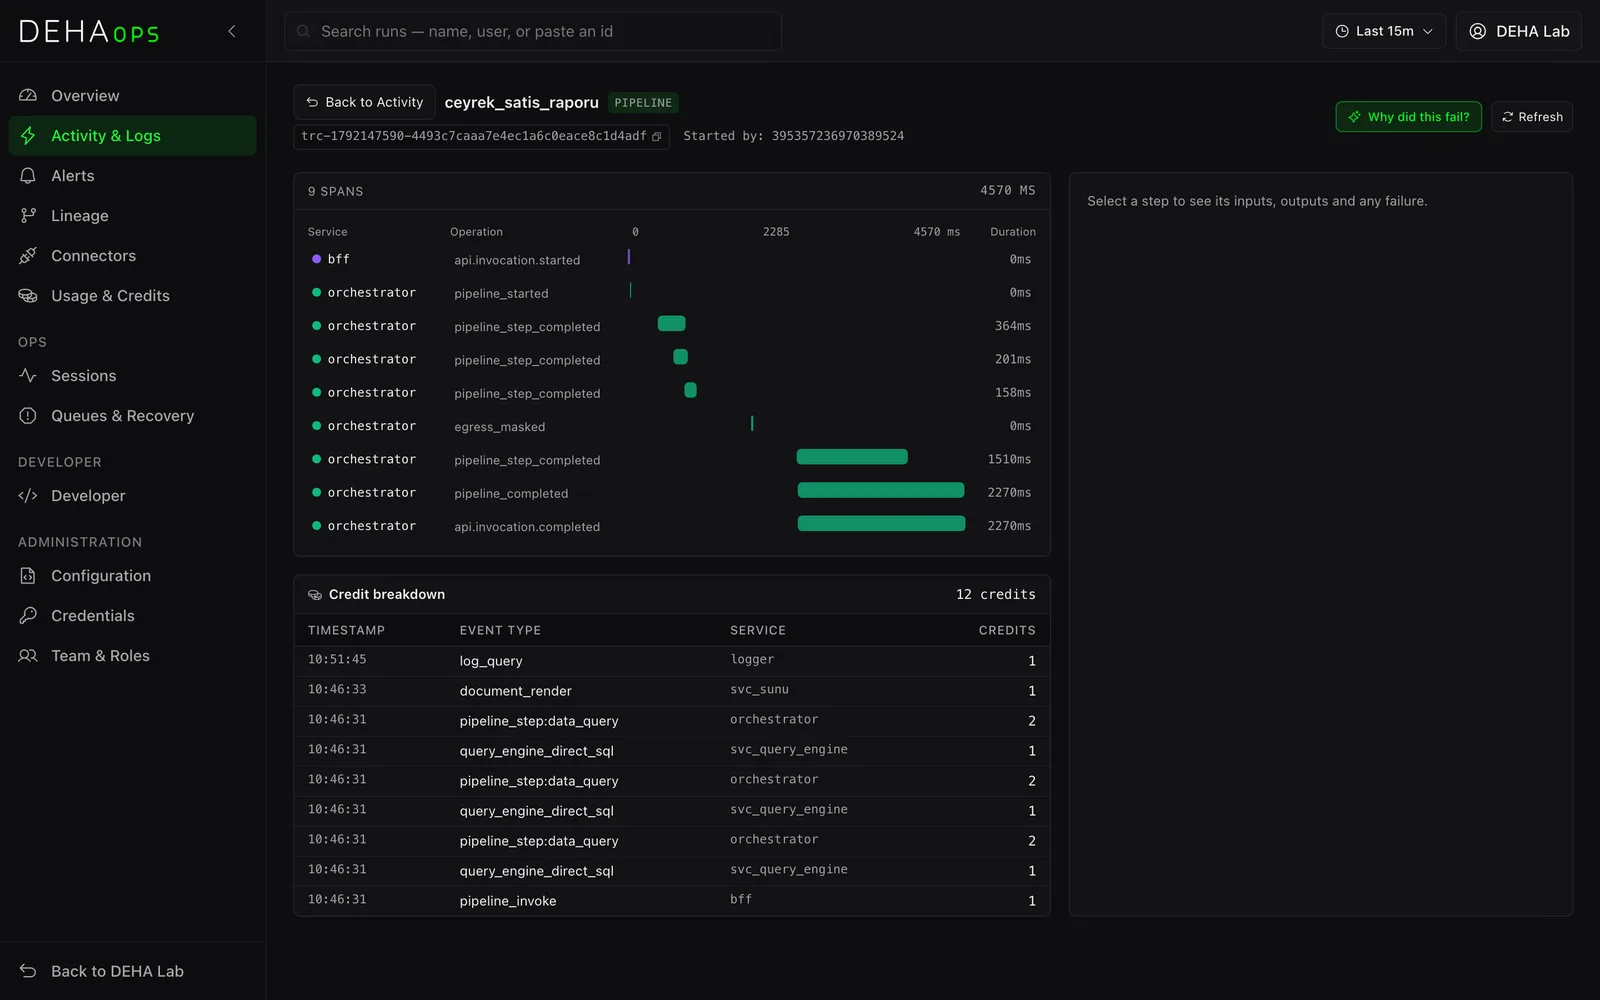
The trace of every run
The report's run, step by step, how long each took and the credits each spent. Eleven credits in all.
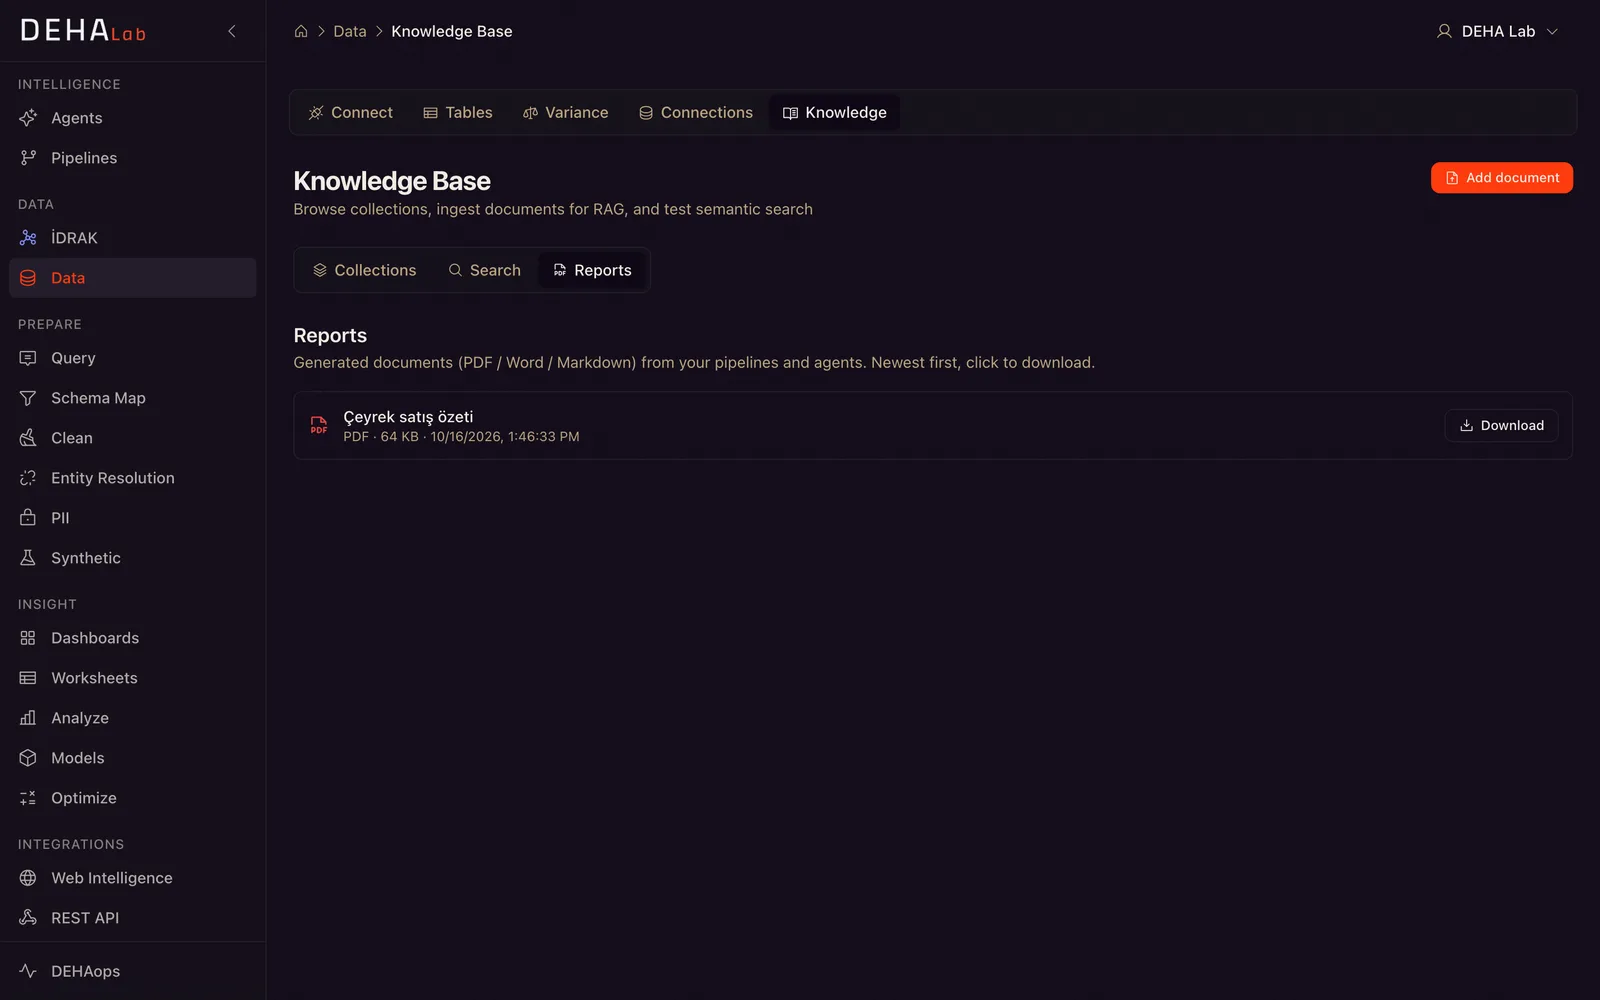
The report, ready
The quarterly summary waits under Reports as a PDF, and is prepared again every Monday at 08:00.
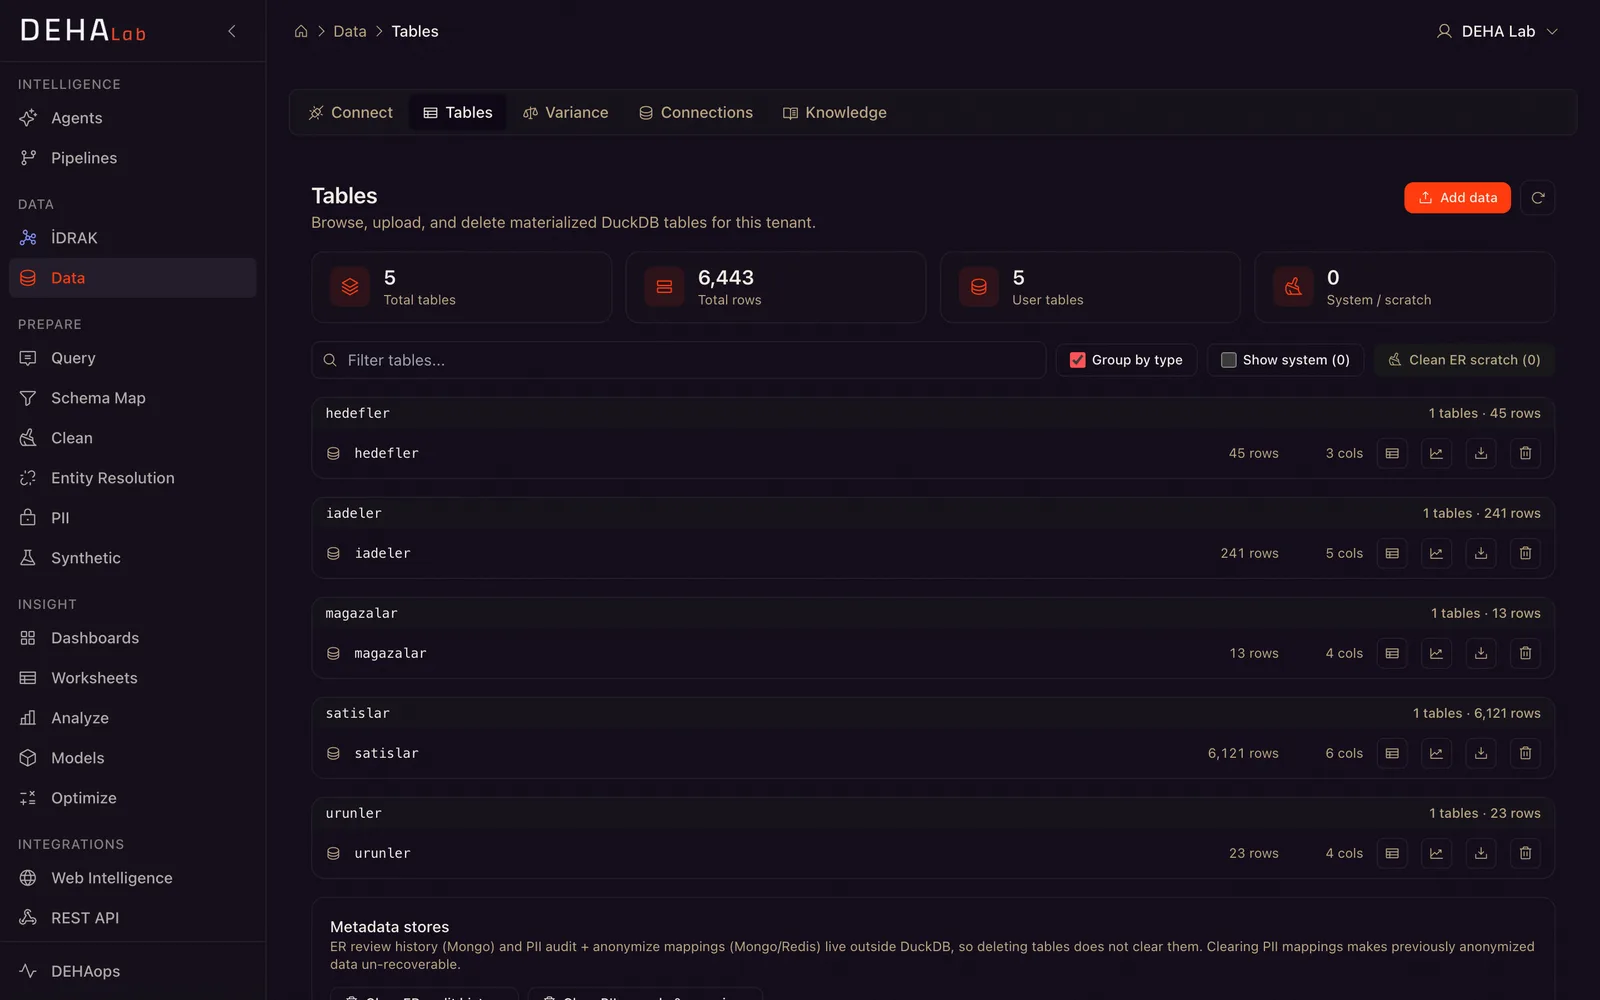
The data it loaded
Five files, five tables, 6,443 rows.
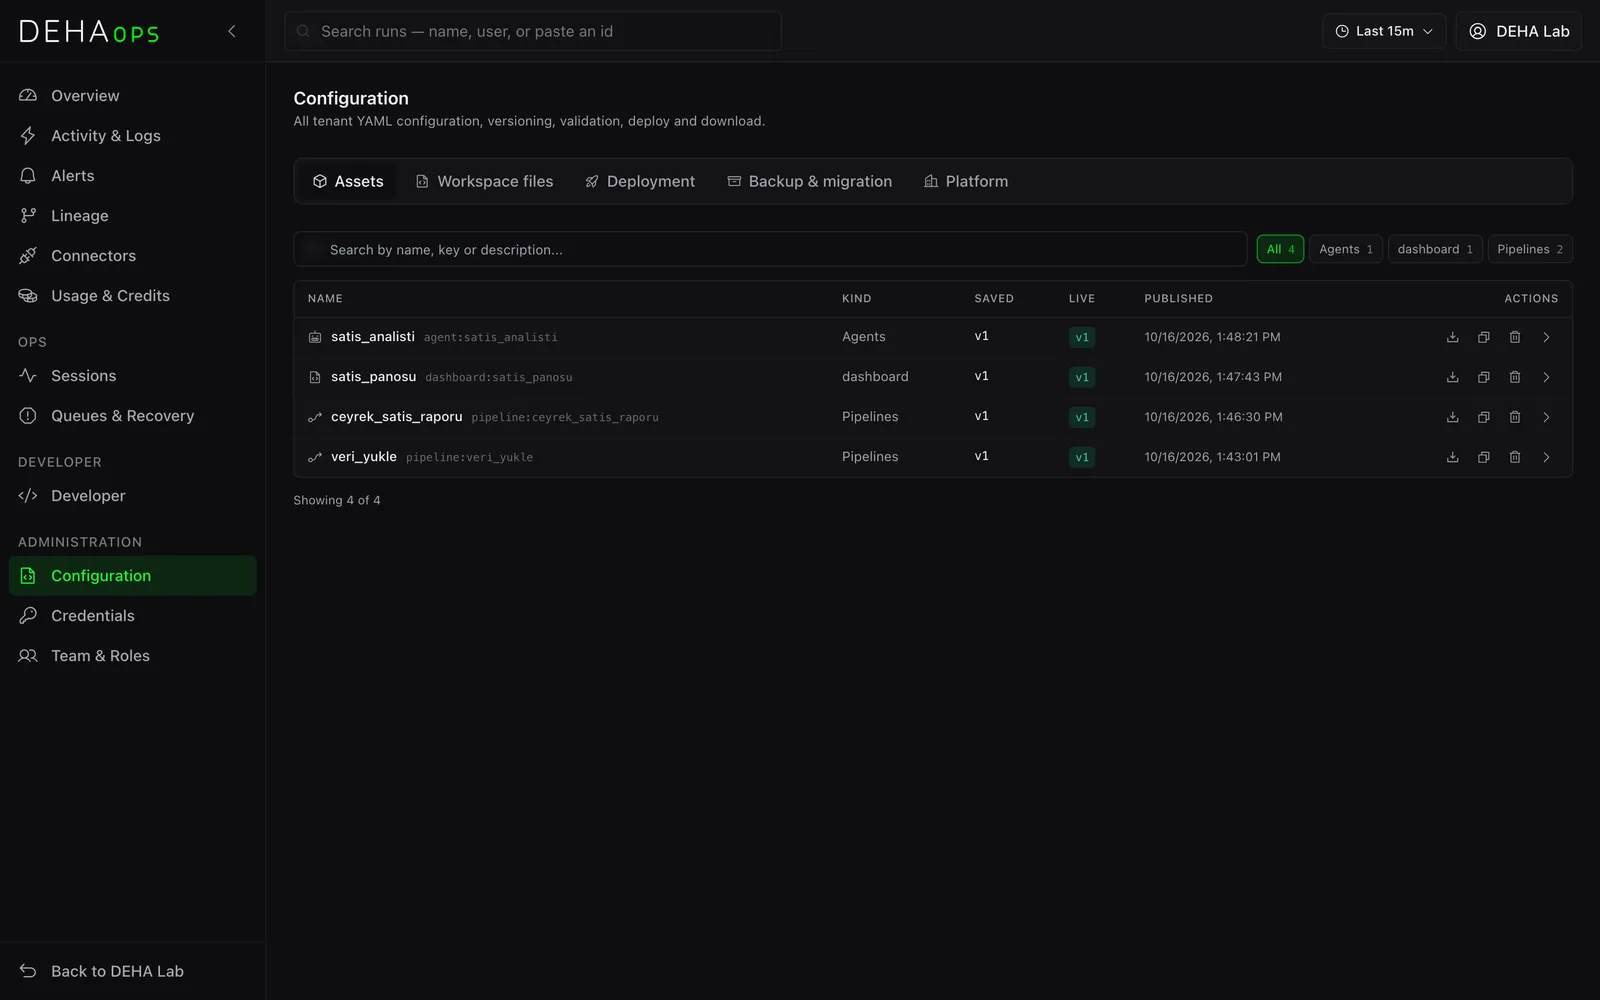
Everything it set up
Each thing the client built is a versioned definition: it can be downloaded, compared and rolled back.
Try it now, see the result.
Sign in and ask your own question.